Multiple Timeframe Analysis for the Pair GBPNZD
1. Pair =GBPNZD
Major Support
2. Support Level =1.9580
Major Resistance
3. Resistance Level =2.0230
4. Extended Resistance level = 2.0850
Monthly Chart
Monthly Chart has been looked for overall direction.
Weekly Chart
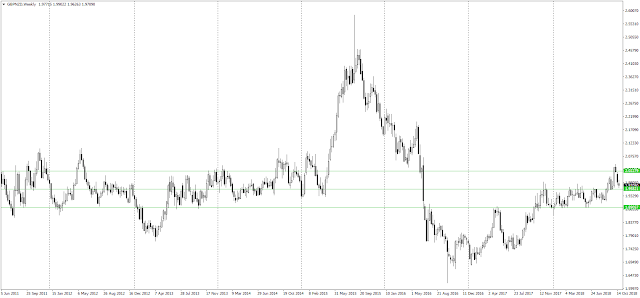
Drawing Support and Resistance by slightly tilt the chart. We can clearly see the Resistance became support and it is retracing to the support level.
Circled are support and Resistance bounced. This chart is Zoomed of the previous and looking close to understand the movement.
previous Weekly chart - but removed cirlce and drawn line just to understand the market movement as well as to understand the trend.
zoomed out again to undertand more detail. it is same Weekly Chart.
Daily Chart
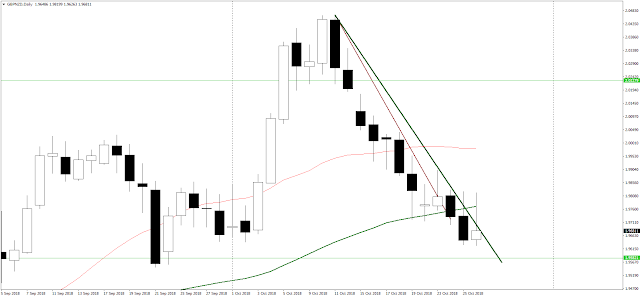
from the above chart we can clearly see that the range has been break out and forming higher high and higher low
Trendline has been drawn. once the Trendline is breakout than it will be assume that -the market is in Buy Zone. as long as the price is below the trend line the market is in sell Zone. but overall market is bullish so we have to find the opportunity to buy the market in order to ride the bull market.
Let zoomed it
as we can see that . it is trying to break out the trendline but not being able to. once it breakout by daily bar then we could find the opportunity for buying from the lower time frame. in this case i have been using 1 hour chart . let see the further process.
Hour Chart
and future movement
Green dotted line are future prediction.
once the trend line break out, multiple way can be used to enter the market for example breakout peaks and couter trend breakout (after each retracement) and many more.
Risk Reward:-
Must use stop loss to prevent excessive loss
Define Reward or pyramiding your position
Conclusion:- In Bullish Market, looking opportunity for buying and must be in the buy zone.
Friday 26 October 2018
Monday 13 August 2018
How to make money using mutltiple timeframes anlysis for pair GBPAUD
Pair = GBPAUD
Market = Bearish Market
Opportunity = Selling Opportunity
Support
level = 1.8350
Level = 1.7590
Resistance
Level = 1.7100
Weekly Timeframe: overall direction is Bearish
we can see the significant supports and resistances including the bearish movement.
Daily Timeframes = To make a decision (Sell or Wait)
Market Start Moving down forming Lower high and Lower low including moving average crossed over.
Detail picture of the Daily Timeframe. Support became resistance that is level 1.7590
Once Fibonacci Retracement has been drawn,
we can clearly see that 50% fobo Retracement has made.
Time Frame = 1 hour Timeframe ( to execute the order)
In 1 hour timeframe , Retracemnt is underway respecting the Trendline towards resistance level 1.7590
once the trendline breakout we could make execute the order.
Note:- This Multiple Timeframe anslysis is only for eductional purpose.
Tuesday 31 July 2018
Monday 30 July 2018
Monday 23 July 2018
Multiple Timeframe Analysis for the Pair GBPJPY
Pair -GBPJPY
Support Level
Major Support level = 139.70
Minor Support level = 145.40
Resistance Levels
Major Resistance Level= 156.80
another strong resistance level = 147.40
Timeframes Use= Weekly, Daily and Hourly

Weekly Timeframe has been used to spots the Support and Resistance.
Daily Time that has been used to get possibities of movement -Up or Down but strong Conviction is
UP
Daily Time Frame Use to Understand the Sell Zone that is below the trendline and buy Zone that is above the Trendline. Trendline is break out and form Higher high and higher low (possiblities) even Fibonacci Retracement has reached or retrace at level 61.8 (following Picture)
Daily Timeframe made me a decision to look for a buying opportunity. It has been Retracing and retrace level at 61.8
I have spotted - it has retraced and break out the trendline.
Conclusion:-
execute - long position
stop loss - 10 pips below the turning point i.e 145.56
Profit Target is 147.50 or fellow the trend and move stop loss until stop out.
Risk Disclaimer
Trading any financial assets can be a challenging and potentially profitable opportunity for investors and Traders. However, before deciding to participate in the Financial Market, you should carefully consider your investment objectives, level of experience, and risk appetite.
Support Level
Major Support level = 139.70
Minor Support level = 145.40
Resistance Levels
Major Resistance Level= 156.80
another strong resistance level = 147.40
Timeframes Use= Weekly, Daily and Hourly

Weekly Timeframe has been used to spots the Support and Resistance.
Daily Time that has been used to get possibities of movement -Up or Down but strong Conviction is
UP
Daily Time Frame Use to Understand the Sell Zone that is below the trendline and buy Zone that is above the Trendline. Trendline is break out and form Higher high and higher low (possiblities) even Fibonacci Retracement has reached or retrace at level 61.8 (following Picture)
Daily Timeframe made me a decision to look for a buying opportunity. It has been Retracing and retrace level at 61.8
I have spotted - it has retraced and break out the trendline.
Conclusion:-
execute - long position
stop loss - 10 pips below the turning point i.e 145.56
Profit Target is 147.50 or fellow the trend and move stop loss until stop out.
Risk Disclaimer
Trading any financial assets can be a challenging and potentially profitable opportunity for investors and Traders. However, before deciding to participate in the Financial Market, you should carefully consider your investment objectives, level of experience, and risk appetite.
Wednesday 18 July 2018
Technical Analysis for the Pair EURJPY - Multiple Timeframe Anlysis
Pair - EURJPU
Trend - Uptrend
Support levels
Major Support level = 126.90
Minor Support level = 130.30
Resistance Level
Major Resistance Level = 136.10
Charts
Monthly - To know the Direction/ to know the support levels and Resistance levels
Daily - To find the trend and make decision - Buy or Wait
Hourly - To Execute the positon / Entry point, Exit point
First Two Charts are montly
then Two Charts are daily
final Chart is 1 hour Char
Conclusion:
once the Trendline break out and there is bullish momentum then we can take long postion at level 130
Update:
Finally EURJPY has completed the Retracment and break out the Trendline.
Daily Time frame shows that retrace level is 76.4
Same Picture of Daily Time frame. but we ccan see that trend line is break out and moving up to acheive the edge
Conclusion:
Make sure about the proper Stop loss and profit taking methods have been applied.
Trend - Uptrend
Support levels
Major Support level = 126.90
Minor Support level = 130.30
Resistance Level
Major Resistance Level = 136.10
Charts
Monthly - To know the Direction/ to know the support levels and Resistance levels
Daily - To find the trend and make decision - Buy or Wait
Hourly - To Execute the positon / Entry point, Exit point
then Two Charts are daily
final Chart is 1 hour Char
Conclusion:
once the Trendline break out and there is bullish momentum then we can take long postion at level 130
Update:
Finally EURJPY has completed the Retracment and break out the Trendline.
Daily Time frame shows that retrace level is 76.4
Same Picture of Daily Time frame. but we ccan see that trend line is break out and moving up to acheive the edge
Conclusion:
Make sure about the proper Stop loss and profit taking methods have been applied.
Monday 16 July 2018
Technical Analysis for the Pair NZDJPY - By Using Multiple Timeframes
First of all, we need to find out Support and Resistance. Regarding the Pair NZDJPY i have been using weekly and Montly chart to find out the support, Resistance and Trend. In this particular charts i have found that level 75.75 as a support and Resistance levels are 79.80 and 83.20.
if we look at Daily Timeframe Down Trend is exist
Possibilites
1. If it does break out and form Higher High and Higher low in Daily Timeframe then it takes rally to the level 79.80 further leve 83.20
2. If downtrend continues and Retest Level 75.75 then it will go down to level 68.90
Conclusion
As weekly chart shows that the level 75.75 is Significant Support which might be hard to break. At that level it has been many times bounce backed. It is possible level to turn to up.
Thursday 5 July 2018
Financial Market Terminology
Financial Market Terminology
1. Spread
2. Ask/Sell Price
3. Bid/Buy Price
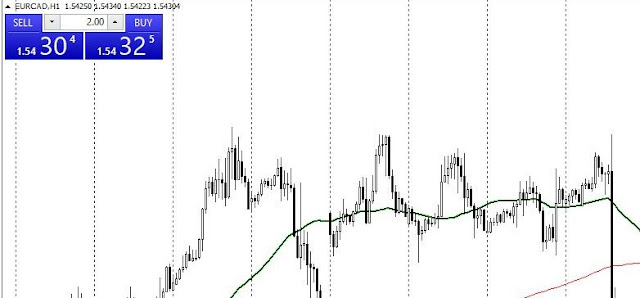
In the following Picture, Ask/Sell price is 1.5430(4)
and Bid/Buy Price is 1.5432(5) the
price difference between Buy and Sell is called Spread. Where end of the numbers (4)and (5) are called points in the forex. If
price move from 1.5430(4) to 1.5431(6) which is 1 pip and 2 points move
In the example below
current market price for Share A is £11.50. if you want to buy that particular
share then you need to Pay £11.55 instead of £11.50 just because of Spread, the
price difference between Market Price and Bid price is called spread. Similarly if you want to sell then you will
get £11.45 instead of £11.50, the price difference between Market Price and Ask
price is called Spread.
Types of Order
In the Financial
Market, the terms Buy, Sell, Buy Stop, Sell Stop, Buy Limit, Sell Limit are
come to use. In this section, These terms will be explained.
Buy/ Buy Stop/ Buy Limit:
Buy price normally
assume the Market Price. In the example below, market price is £11.50 (Red
Line). If you want to buy the Share A at Market Price you will have to pay £11.50.
If you want to buy Share
A when the price will be at £11.80 by hoping the price will go up then you need
to place Buy Stop order. Let’s say your market price is at £11.50 and have
placed Buy Stop Order at £11.80 by hoping the price will rally. If it does not
reach £11.80 then your order will not execute. Only your order will execute
once it reaches the level £11.80.
If you want to buy Share
A when the price will be at £11.00 by hoping the price will retrace and go up
then you need to place Buy Limit order. Let’s say you have place Order at £11.50
(Market Price) hoping the price will retrace the level £11.00 and would like to
buy at that price, is called Buy Limit Order. If it does not reach level £11.00
then your order will not execute. Only your order will execute once it reaches
the level £11.00.
Sell/ Sell Stop/ Sell Limit
Sell price normally
assume the Market Price. In the example below, market price is £11.50 (Red
Line). If you want to sell the Share A at Market Price you will get £11.50.
If you want to Sell Share
A when the price will be at £11.20 by hoping the price will down (or to protect further losses) then you need
to place Sell Stop order. Let’s say your market price is at £11.50 and have
placed Sell Stop Order at £11.20 by hoping the price will down (or to avoid more losses). If it does not
reach £11.20 then your order will not execute. Only your order will execute
once it reaches the level £11.20.
If you want to Sell Share A when the price will
be at £12.00 by hoping the price will retrace and go down then you need to place
Sell Limit order. Let’s say you have place Order at £11.50 (Market Price)
hoping the price will retrace the level £12.00 and you would like to sell at
that price, is called Sell Limit Order. If it does not reach level £12.00 then
your order will not execute. Only your order will execute once it reaches the
level £12.00.
In the Financial Market, Buy Stop order, Buy Limit Order, Sell Stop Order, Sell Limit Order are used for opportunity to get the best price and protect the losses. These Orders are automated once you filled which can execute without presence in the market.
Subscribe to:
Posts (Atom)


